Every number shows how it was calculated.
The math stays on screen, next to the number
How FAYOL calculates it
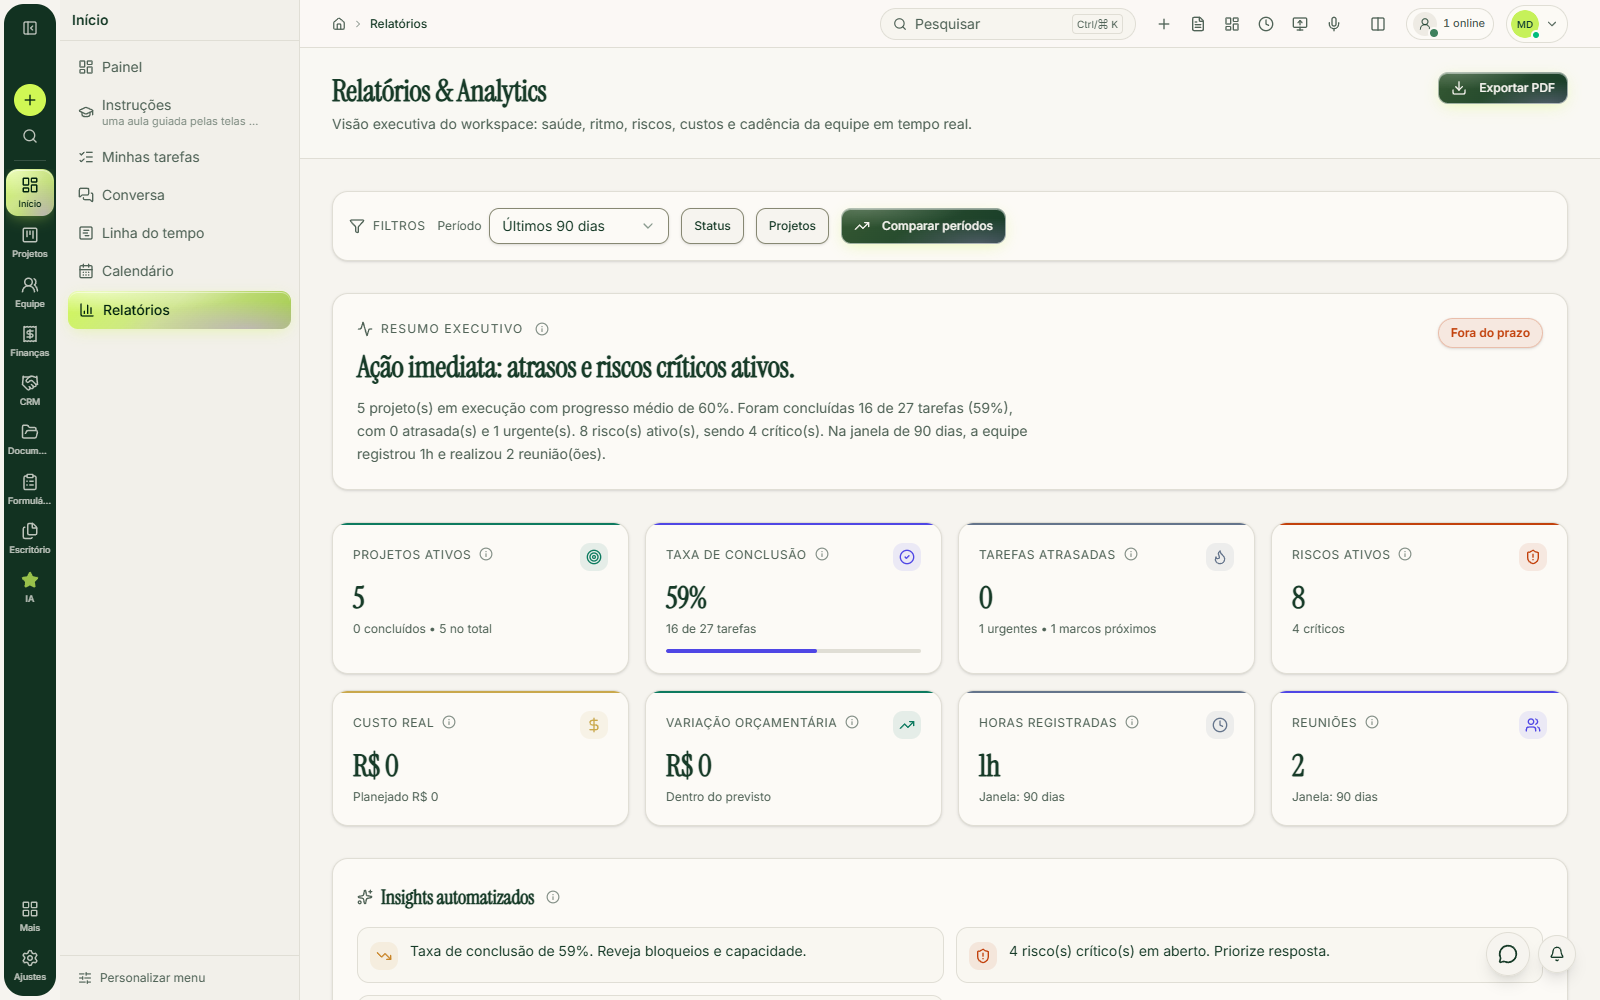
(completed tasks / total tasks) × 100, within the projects and period you filtered.
How FAYOL calculates it
Tasks still open whose deadline has passed: the number is the length of that list.
How FAYOL calculates it
Impact × likelihood, scored 1 to 5. From 12 up, the risk is high and needs a response plan.
How FAYOL calculates it
Planned minus what's already been spent, project by project. Positive means savings; negative, overspending.
No more “where did this number come from?”
The list opens with each task's project and how many days past the deadline it is.
How much each project used and the total per day.
Project by project, with overruns at the top.
Trends, phases, milestones and status history.
Filter, compare and send it to leadership
Period and projects
From seven days to twelve months. Select the projects and statuses you want.
Comparison with the previous period
The same time window right before it, side by side.
Ready-made executive summary
A paragraph at the top, ready to paste into the email to leadership.
PDF in one click
The whole dashboard, paginated for printing. Anyone whose role allows it can export.
Portfolio: what to prioritize, with stated criteria
How the score works
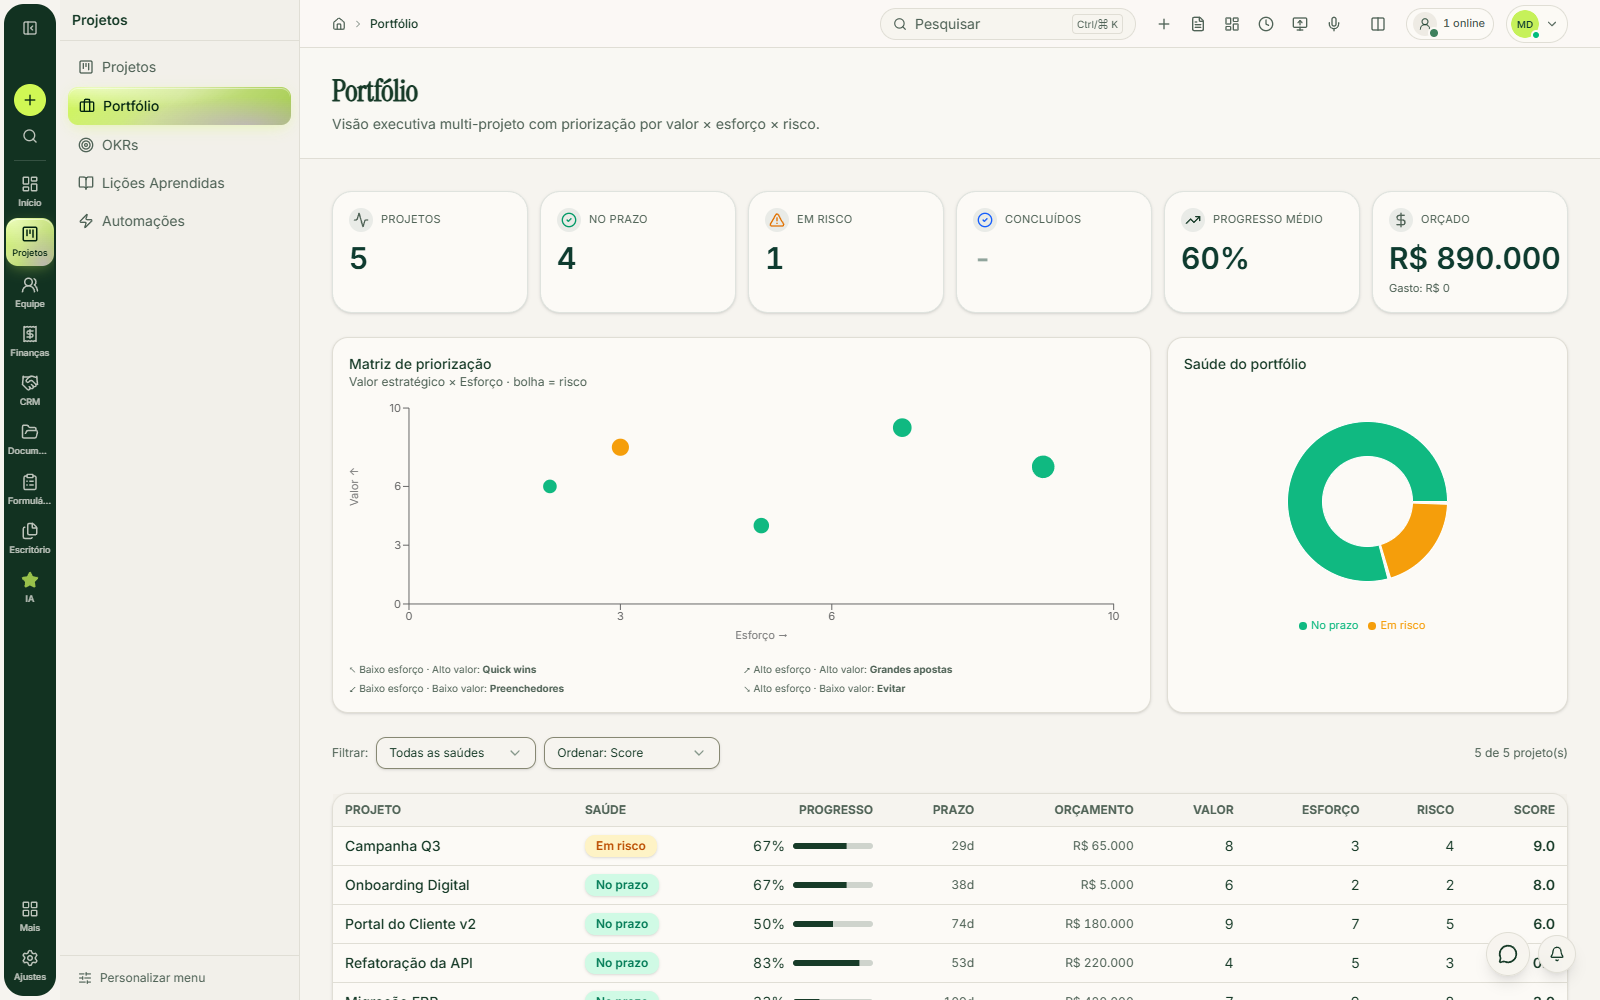
Score = 2 × value − effort − risk
Value, effort and risk are scores you give each project. Value counts double: what brings a return goes ahead of what's merely easy.
And on the chart
Each project is a point between value and effort, and the four corners come labeled:
- Quick wins: low effort, high value
- Big bets: high effort, high value
- Fill-ins: low effort, low value
- Avoid: high effort, low value
Who's overloaded
Two bars per person: logged hours and what open tasks still commit them to. Above 100%, the bar turns red, and the warning comes before the overload.
Ask for the formula. We already put it on screen.
7 days free, no card. Check every calculation on the dashboard before you subscribe.